Data Visualization: Turning Complexity into Conversion
Recognized as a Top 100 innovator in US by Top 100 Magazine and a visionary featured in over 15 major media publications including Forbes, Wired, and Yahoo Finance, the strategist behind these insights brings over 25 years of experience in driving performance and revenue growth. He has managed 172 projects and served 1.52 million happy customers, leveraging one US utility patent with a CIP to deliver data-driven results for global corporations and ambitious entrepreneurs alike.
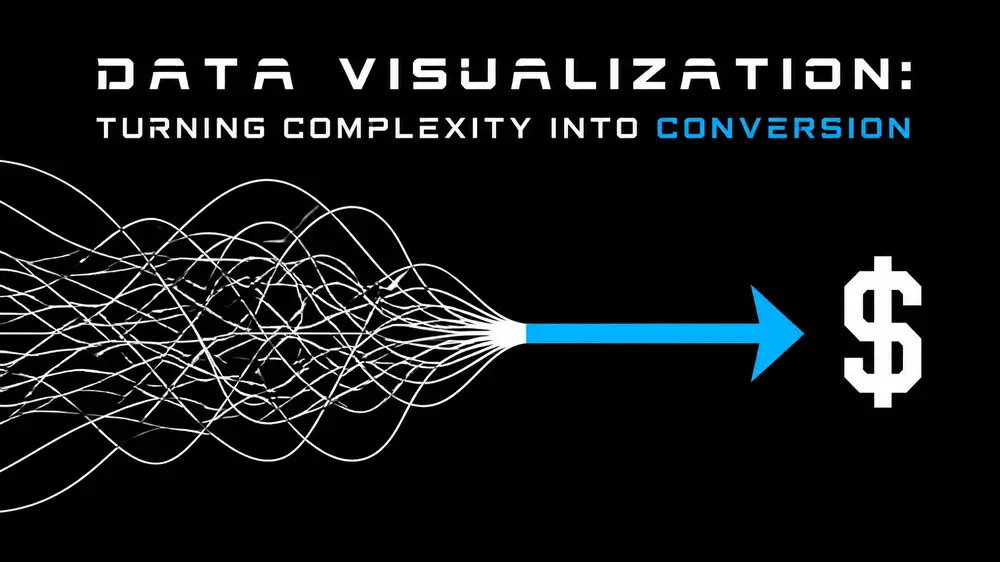
In the modern SaaS landscape, data is abundant, but clarity is scarce. Most platforms drown their users in a sea of metrics, assuming that more information leads to better decisions. The reality is the opposite: cognitive overload paralyzes the user journey and kills conversion rates. To drive revenue, data must be transformed from a static asset into a dynamic conversion engine through strategic visualization.
The cognitive cost of complexity
Complexity is the enemy of conversion. When a user enters a SaaS dashboard and is met with a wall of unexplained numbers and overlapping charts, the friction increases exponentially. He understands that the goal of effective UI/UX design is not merely to display data, but to facilitate a decision.
For a SaaS product to thrive in 2026, it must move beyond reporting and into the realm of prescriptive analytics. This means every pixel must serve the user's progress toward a key milestone. Whether the goal is completing an onboarding sequence, upgrading to a premium tier, or reducing churn, visualization is the bridge between raw information and profitable action.
Strategy 1: the decision-driven funnel
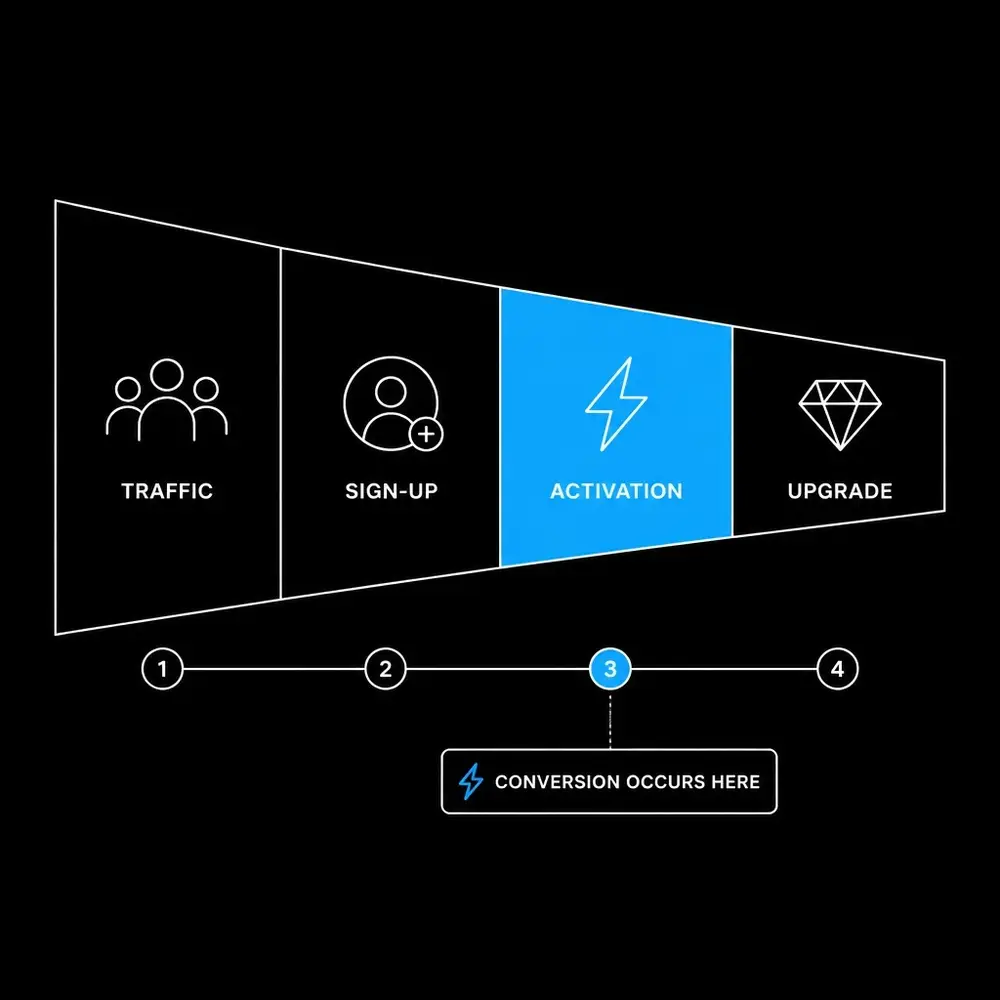
Most SaaS companies track their funnels, but few visualize them in a way that reveals the "why" behind the drop-off. A standard funnel chart shows where people leave; a conversion-optimized visualization shows why they are leaving.
He emphasizes that high-performing SaaS products must map their visuals directly to the user's mental model. This involves identifying the "Aha!" moment: the specific point where a user realizes the value of the product: and building every visualization around it.
- Identify Friction Points: Use step-wise percentage visualizations to highlight the largest gap between sign-up and activation.
- Highlight Activation: The "Activation" stage should be the focal point of the onboarding dashboard. If a user hasn't hit this milestone, no other metric matters.
- Segmented Clarity: Break down conversion by acquisition channel or persona. A one-size-fits-all visualization often hides the truth that one segment is thriving while another is failing.
Strategy 2: retention through cohort visualization
Conversion is not a one-time event; it is a recurring commitment. Retention is the silent driver of SaaS revenue, yet it is often the most poorly visualized metric in the industry. He utilizes cohort heatmaps to provide a temporal view of user behavior, allowing teams to see exactly when the "leaky bucket" begins to fail.
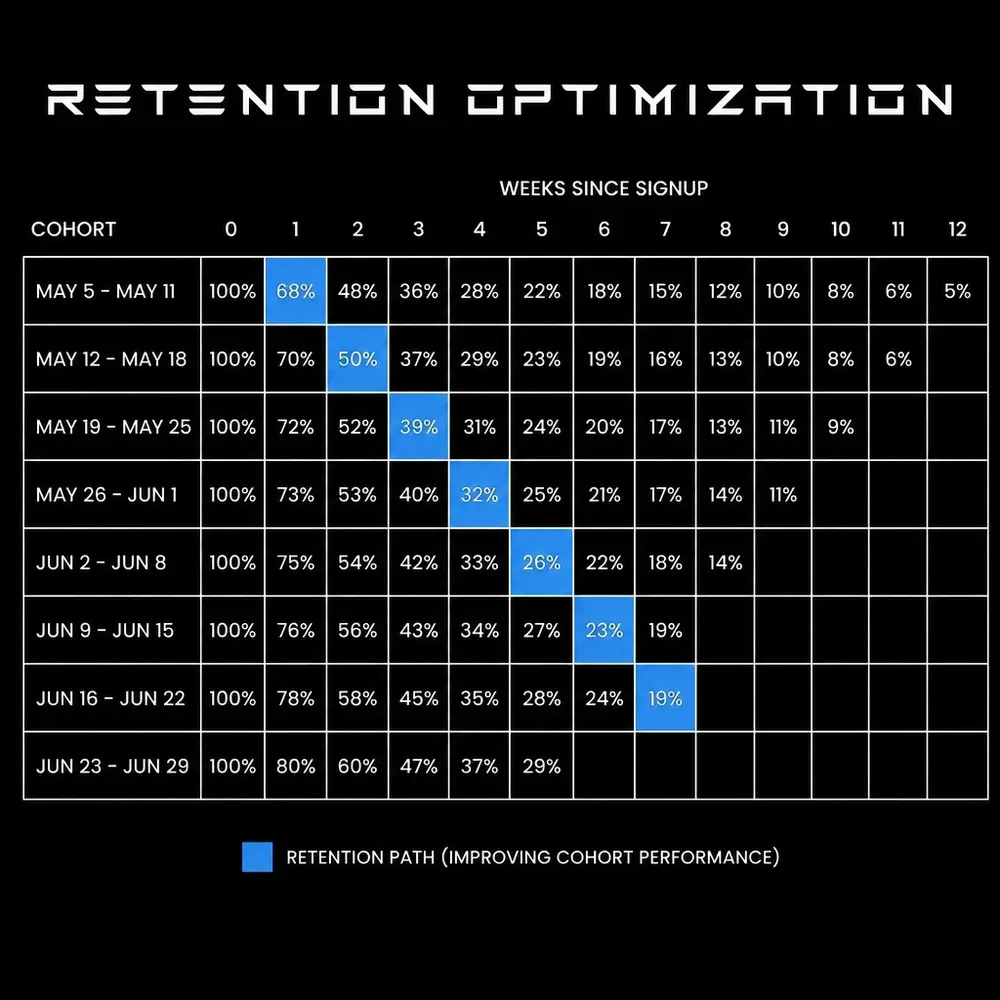
A minimalist cohort heatmap allows product managers to track the impact of new feature releases or UI updates in real-time. By comparing cohorts from Month 1 against Month 6, he can quantify the long-term ROI of product design improvements. This data-driven approach removes guesswork from the development cycle, ensuring that every update contributes to a higher lifetime value (LTV).
Strategy 3: integrating feedback and experimentation
In the competitive SaaS market, resting on a static design is a recipe for obsolescence. The most successful products integrate A/B testing and user feedback directly into their data visualizations. This creates a closed-loop system where experimentation informs design, and design drives conversion.
- Overlay Experiment Variants: Visualizing control vs. treatment groups on the same trend line allows for immediate identification of winning strategies.
- Sentiment Mapping: Combining quantitative usage data with qualitative feedback (NPS or satisfaction scores) provides a 360-degree view of the user journey.
- Real-Time Alerts: Automated visual cues that trigger when conversion falls below a specific threshold allow for proactive intervention before revenue is lost.
The power of expert product management
Driving millions in revenue for clients requires more than just aesthetic sensibility; it requires a fusion of business acumen, creative vision, and technical precision. He maintains a 95% rating in both UI/UX design and product management, a rare combination that ensures every design choice is backed by a robust business case.

His approach combines design thinking with deep analytical insights. This includes a strict adherence to ADA compliance (rated at 90%), ensuring that digital products are accessible to all users, thereby expanding the potential market reach and avoiding legal friction. When data visualization is inclusive, it reaches a wider audience and drives higher overall conversion.
Scaling success for global corporations
The impact of these strategies is not theoretical. With a proven track record of managing 172 projects and generating significant revenue growth, his methodology is designed for scale. Whether it is a startup looking for its first 1,000 users or a global corporation managing a user base of millions, the principles of clear, actionable data visualization remain the same.
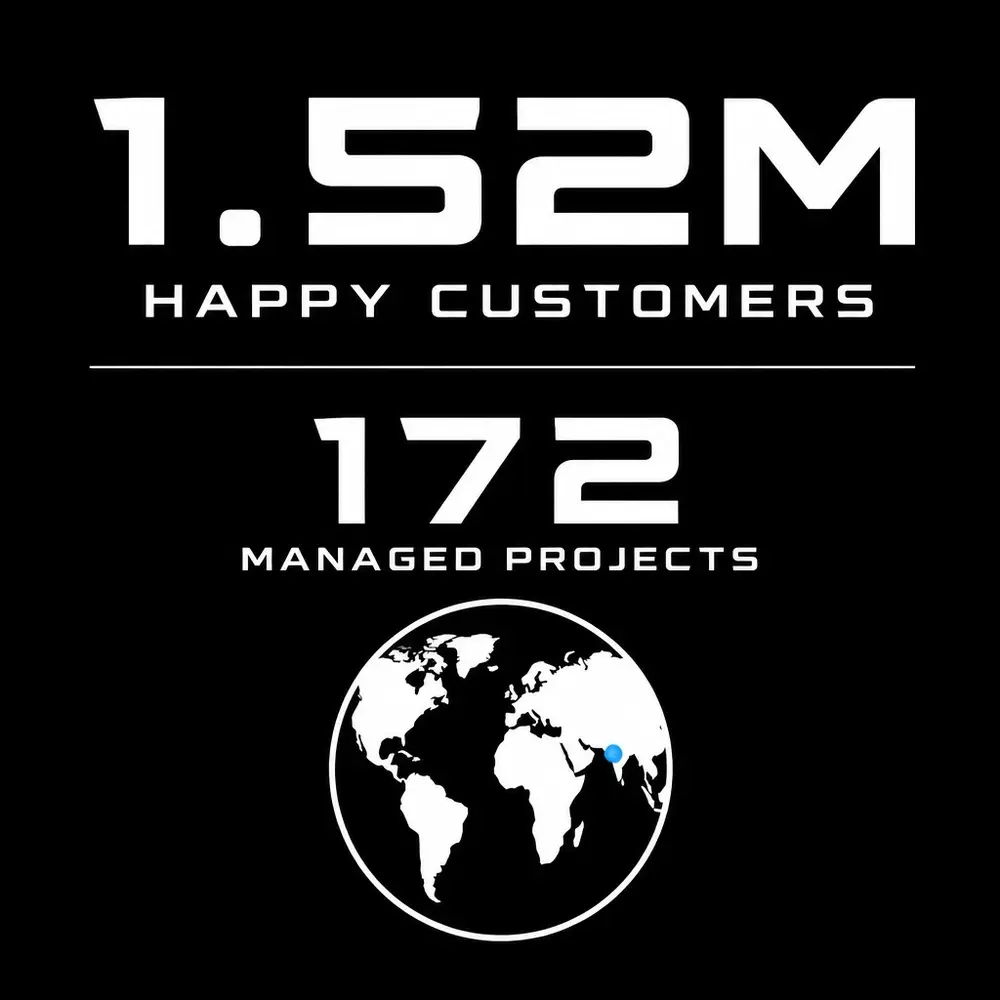
The numbers speak for themselves: 1.52 million happy customers and a career built on innovation. By focusing on the core metrics that matter: activation, retention, and conversion: he helps businesses navigate the complexities of the digital age with confidence and precision.
Conclusion: your path to conversion
Data visualization is the silent salesman of your SaaS product. It guides the user, simplifies the complex, and ultimately drives the decisions that lead to revenue. If your current product feels cluttered, confusing, or stagnant, it is likely a symptom of a visualization strategy that prioritizes data over decisions.
Turning complexity into conversion is a meticulous process that requires a blend of creative design and rigorous analysis. From prototyping and market research to data visualization and process improvement, the path to growth is paved with clear insights. We are here to help you unlock the full potential of your product and turn your data into your greatest competitive advantage.