Data Visualization Secrets: How Top 100 Innovators Turn Analytics into Executive Decisions
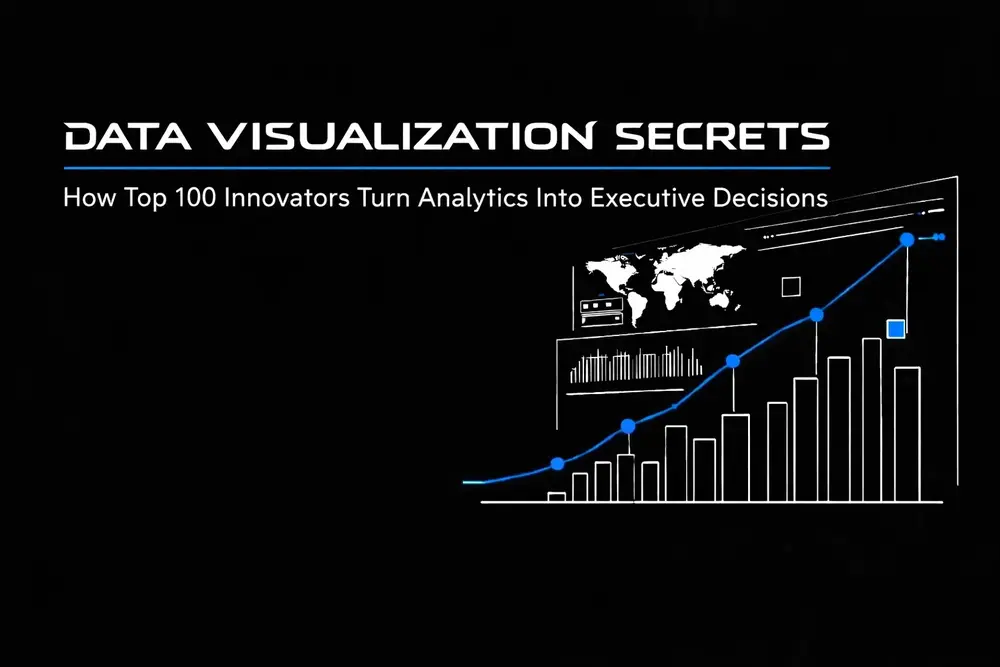
Top 100 Innovators operate in an environment where data is abundant and clarity is rare. Turning raw analytics into executive decisions is a competitive necessity. For high-level leaders, time is the most precious commodity, and analytics that require interpretation time get ignored.
The core challenge is consistent across organizations: dashboards ship with impressive data volume and weak decision utility. Data visualization solves this by compressing complexity into instantly readable patterns, exposing risk early, and creating alignment across stakeholders. The goal is controlled time-to-insight: less time debating numbers, more time executing strategy.
The Neuroscience of High-Speed Decision Making
The human brain is biologically hardwired for visual stimuli. Research confirms that the brain processes visuals 60,000 times faster than text. Furthermore, individuals retain approximately 80% of what they see, compared to a staggering 20% of what they read. This cognitive reality is the foundation of high-performance data visualization.
When an executive is presented with a spreadsheet, the cognitive load required to parse rows and columns creates a bottleneck in decision-making. Conversely, a masterfully designed dashboard allows for instantaneous pattern recognition. Statistics show that managers utilizing advanced data visualization tools are 28% more likely to gather critical information promptly than those relying on traditional reporting.
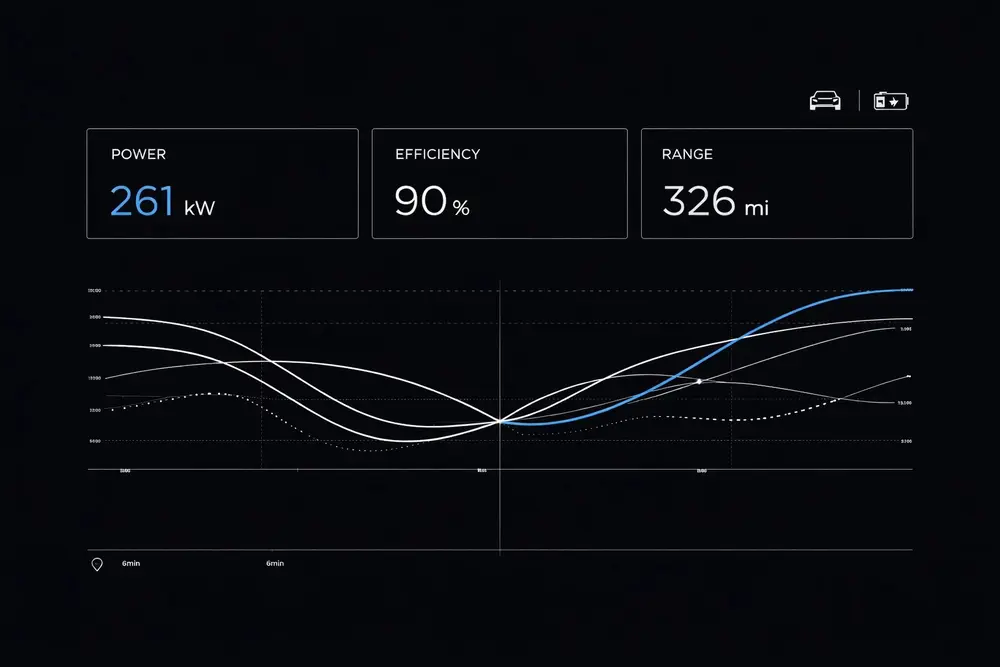
By leveraging these neurological advantages, teams streamline the path from data ingestion to strategic execution. The discipline is reducing the "time-to-insight," ensuring stakeholders spend less time questioning the data and more time using it to drive outcomes.
Tesla-Inspired Minimalism: The Aesthetic of Efficiency
Modern data visualization often suffers from "chart junk": an excess of decorative elements that obscure the underlying message. A Tesla-inspired aesthetic fixes this: futuristic, high-contrast, and ruthlessly minimalist. This approach prioritizes the signal while aggressively eliminating the noise.
Just as the interior of a Tesla vehicle consolidates complex vehicle diagnostics into a single, intuitive interface, high-level UX design must distill millions of data points into a handful of actionable KPIs. This minimalist philosophy is not about removing information; it is about organizing it with surgical precision.
- Visual Hierarchy: A strict hierarchy ensures the most critical metrics occupy the most prominent visual real estate.
- Color Theory for Performance: A disciplined palette uses color exclusively to denote status (growth, risk, anomaly), preventing visual fatigue.
- Clean Lines and Negative Space: Effective white space ensures executive focus is never diverted by unnecessary UI components.
This design language creates a sense of control and clarity. When an interface looks and feels like the future, it empowers the user to lead with confidence.
Bridging the Gap Between Analytics and Strategy
One of the most significant challenges in large-scale organizations is the communication gap between technical data scientists and non-technical executive leadership. With 65% of the population identifying as visual learners, data visualization serves as a universal translator.
This gap shows up as misaligned KPIs, competing definitions, and dashboards that report activity instead of decisions. Visualization acts as the bridge by converting intimidating numerical arrays into intuitive graphics so the rationale behind strategy is understood across levels of the organization. This alignment protects organizational velocity. When engineering, product, finance, and the C-suite see the same trend line, consensus is reached faster and friction is eliminated.
The Quantifiable ROI of Visual Intelligence
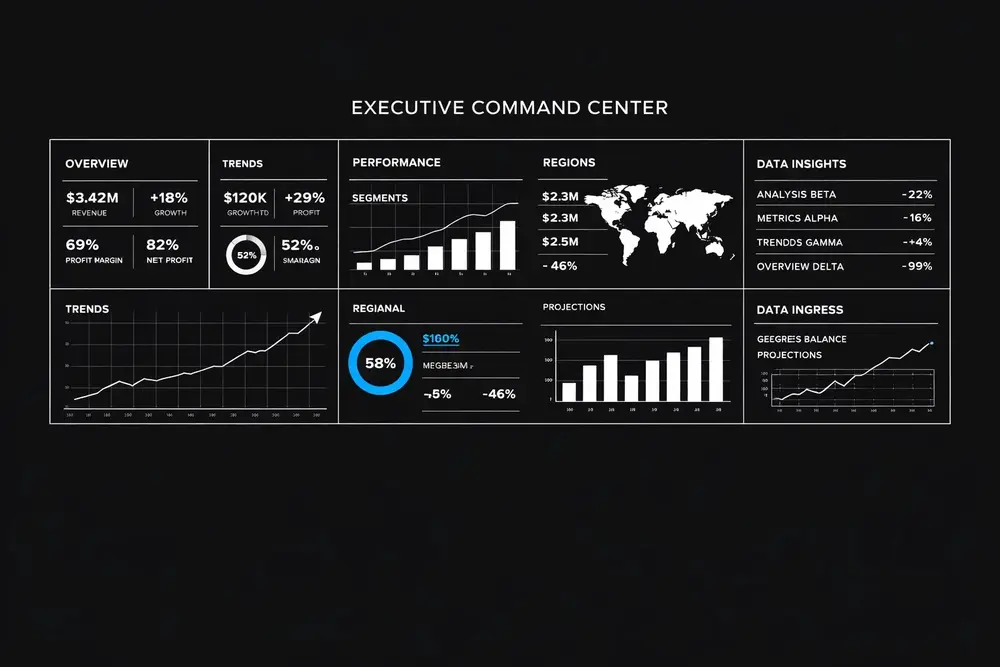
The implementation of sophisticated visualization tools is not an aesthetic choice; it is a financial one. Organizations that successfully integrate visualization into their decision-making processes witness measurable improvements in their bottom line.
- Sales Growth: Companies leveraging visual data discovery tools see up to 85% higher sales growth.
- Risk Mitigation: Organizations reduce operational risk when teams use shared, high-fidelity dashboards with consistent definitions.
- Operational Speed: Decision-making speed improves when data is presented visually rather than textually.
- Efficiency Gains: Efficiency spikes when manual, fragmented reports are replaced with interactive, real-time visual interfaces.
These outcomes happen when visualization is treated as a revenue and performance engine. The dashboard stops being a report and becomes a strategic asset.
Turning Analytics Into Executive Decisions: A Framework
To turn data into decisions, a structured framework is required. The work starts by defining what truly matters for the executive audience and removing everything else.
1. KPI Spotlighting
Not all data is created equal. A "Top 100 Innovator" knows that an executive dashboard should only track metrics that are directly tied to the organization’s primary goals. By spotlighting these Key Performance Indicators, he prevents information overload and keeps the focus on high-stakes outcomes.
2. Contextualization
Data without context is a liability. Effective visualization provides the "why" behind the "what." Historical benchmarks and forecasting allow executives to see where performance has been and where it is likely headed.
3. Actionability
Every visualization should prompt a question or an action. If a chart shows a decline in user retention, the interface should provide a direct path to the underlying cause. The system must be not just descriptive, but prescriptive.

The meticulous attention to detail found in high-end design mirrors the precision required in executive data visualization, where every element must serve a functional purpose.
Driving Performance at Scale
Analytics programs fail at scale for predictable reasons: inconsistent metric definitions, lagging data pipelines, dashboards overloaded with vanity metrics, and visual design that hides the signal. Fixing this requires a doer’s discipline: ruthless prioritization, clean information architecture, and a decision-first KPI model that turns charts into action.
The work is equal parts strategist and executor. It combines business acumen, UI/UX rigor, and data thinking to produce interfaces that leadership trusts under pressure.
The Future of Visual Decision-Making
As AI and machine learning continue to evolve, the volume of data will only increase. The challenge for future leaders is not getting more data; it is extracting meaning from the data already available and turning it into a decision advantage. The next generation of interfaces will compress analysis even further with automated anomaly detection, narrative insights, and decision-guided workflows.
The result is a digital ecosystem where information flows seamlessly, decisions are made with certainty, and organizations move at the speed of thought. The secret is not just in the data. It is in how clearly it is seen.
If you need to reduce time-to-insight, clean up KPI definitions, or rebuild dashboards that executives actually use, you can get help with that. We are here to help.
Email blog and social media approval requests to norman@igenapps.com.