Data Visualization: Making Billion-Dollar Decisions Easy

Recognized as a leading authority in digital transformation and featured in major media publications including Forbes, Wired, Yahoo Finance, AP, and Telemundo, the subject of this analysis has spent over two decades redefining how global entities interact with information. As a member of the Top 100 innovators in US list by Top 100 Magazine, He brings a level of strategic depth to data visualization that transcends simple chart creation. With 25+ years of experience driving performance and revenue growth, He has mastered the art of converting overwhelming data streams into clear, actionable intelligence for high-stakes environments.
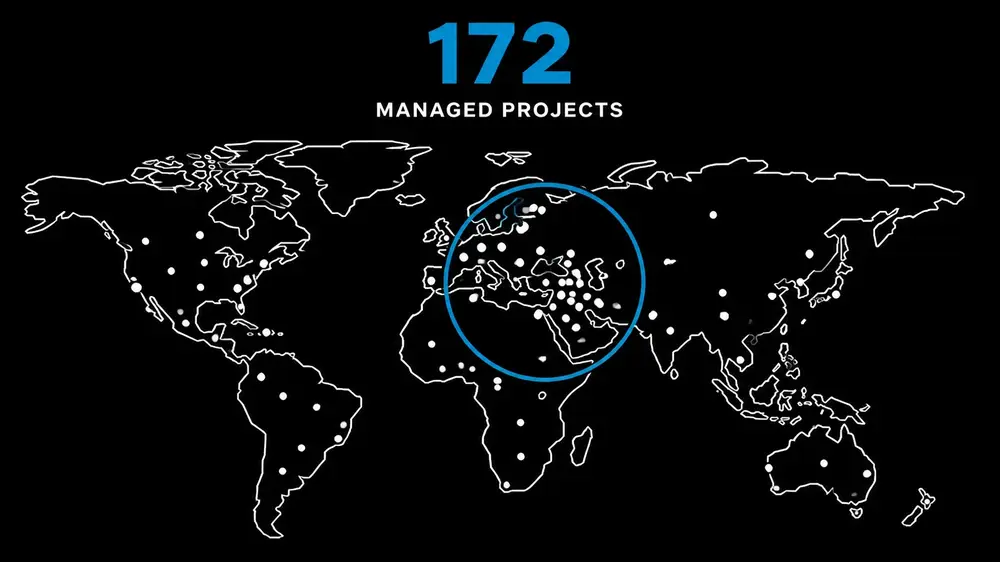
In the modern corporate landscape, a single decision can involve billions of dollars in capital allocation, supply chain shifts, or market entry strategies. At this scale, the margin for error is non-existent. He approaches data visualization not as a creative exercise, but as a critical business tool designed to eliminate ambiguity and facilitate rapid, high-confidence decision-making. Through 172 managed projects and a track record of serving 1.52M happy customers, He has proven that clarity is the ultimate competitive advantage.
The weight of capital: navigating complexity
Billion-dollar decisions are inherently volatile, uncertain, and complex. For a global corporation or a visionary entrepreneur, the challenge is rarely a lack of data; rather, it is the saturation of it. He understands that humans are biologically unequipped to grasp the scale of billions through spreadsheets alone. Raw numbers at that magnitude become abstract, losing their connection to real-world risk and opportunity.
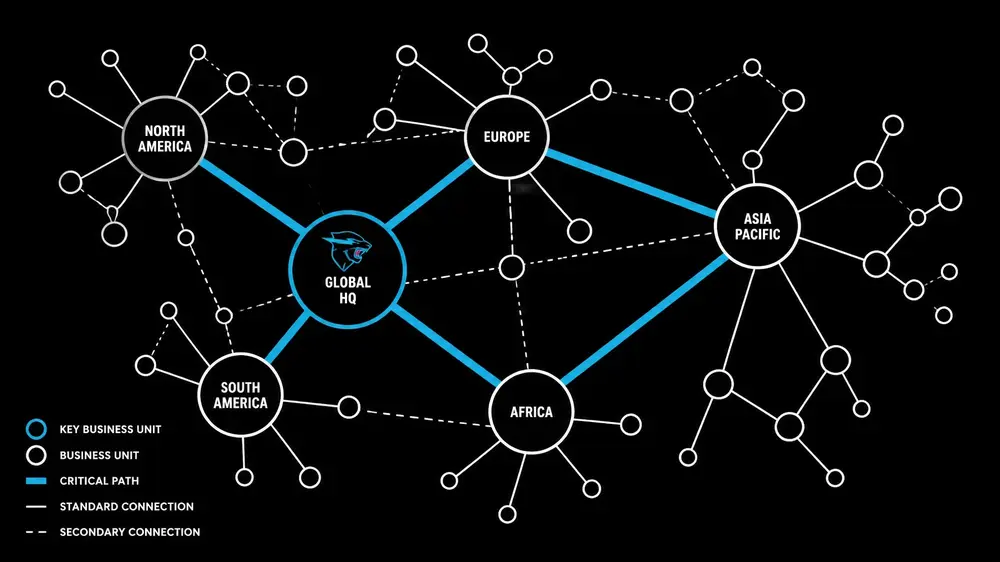
By utilizing advanced data visualization consulting, He transforms these abstract figures into visual hierarchies. Whether it is a capital allocation map or a risk-weighted portfolio view, His approach focuses on "decision-first" design. This means the visualization is constructed around the specific question a leader needs to answer: "Where is our highest exposure?" or "Which market entry yields the greatest ROI relative to risk?"
He creates environments where trade-offs are made explicit. By visualizing scenario sliders and time-series forecasts, He allows executives to "play" with variables in real-time, seeing the immediate ripple effects of a billion-dollar move before a single cent is committed. This level of transparency is what separates market leaders from those who rely on intuition in an era of precision.
Beyond aesthetics: the ROI of precision
While many in the industry focus on the "look" of a dashboard, He prioritizes performance. As a product design consultant with a 95% rating in UI/UX design and a 95% rating in product management, He bridges the gap between technical data science and executive-level business acumen. Every visual element He deploys serves a functional purpose, stripped of "chart junk" or decorative elements that cloud the user’s judgment.
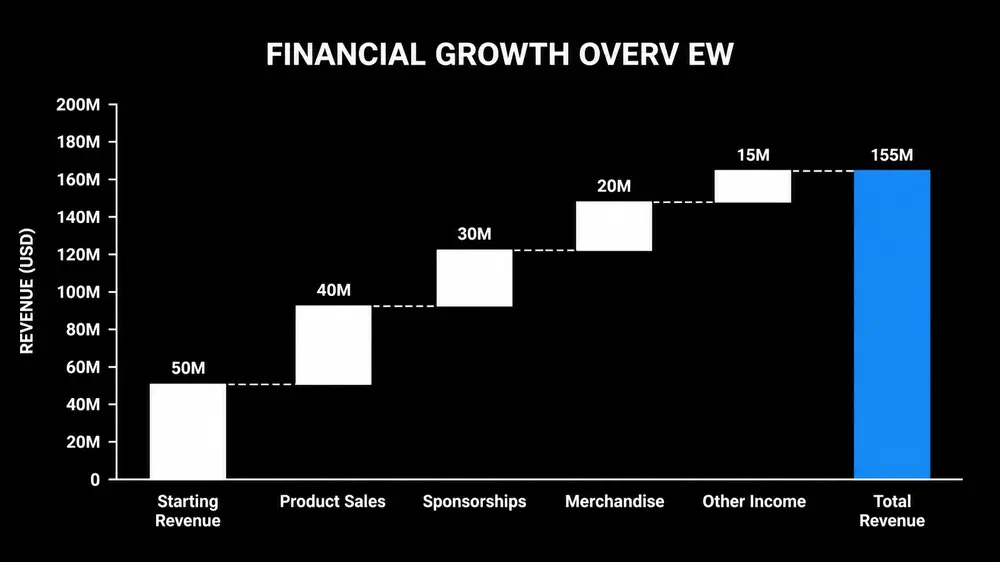
His data-driven approach has consistently generated millions in revenue for clients. By identifying hidden patterns in margin waterfalls or pricing-volume curves, He reveals opportunities that remain invisible to the naked eye. He views a dashboard as a high-performance instrument: like a cockpit for a pilot: where every dial and indicator must be calibrated for maximum accuracy.
The quantifiable impact of His work is evidenced by the scale of His reach. Managing 172 projects requires a relentless focus on efficiency and scalability. He ensures that the visualizations He designs are not just accurate for today, but robust enough to handle the data loads of tomorrow. This forward-thinking methodology is why global brands and business leaders seek His expertise when the stakes are highest.
Global scaling and managed complexity
The ability to serve over 1.5 million customers across diverse industries requires more than just technical skill; it requires a deep understanding of human behavior and cognitive load. He applies design thinking to technical data, ensuring that a CEO in New York and an operations manager in Singapore can look at the same visual and arrive at the same conclusion. This "single version of the truth" is vital for organizational alignment.
His extensive background includes working with global corporations, small businesses, and celebrities, giving Him a unique perspective on how different stakeholders consume information. He has found that whether the user is a board member or a digital marketer, the fundamental need remains the same: the desire for speed and confidence.
His process involves rigorous data analysis and visualization, competitive analysis, and market research. By layering these insights, He provides a comprehensive view of the landscape. It is not enough to show what is happening within a company; He shows what is happening in the context of the entire market. This holistic view is what enables the high-level strategic shifts that drive massive revenue growth.
The intellectual property advantage
One of the most distinct markers of His authority is His status as the owner of 1 US utility patent with a CIP. This extensive IP management experience informs His approach to product design and data visualization. He does not just follow industry standards; He creates them. His work in prototyping and design is grounded in a deep understanding of both the creative and technical capabilities required to build truly innovative solutions.
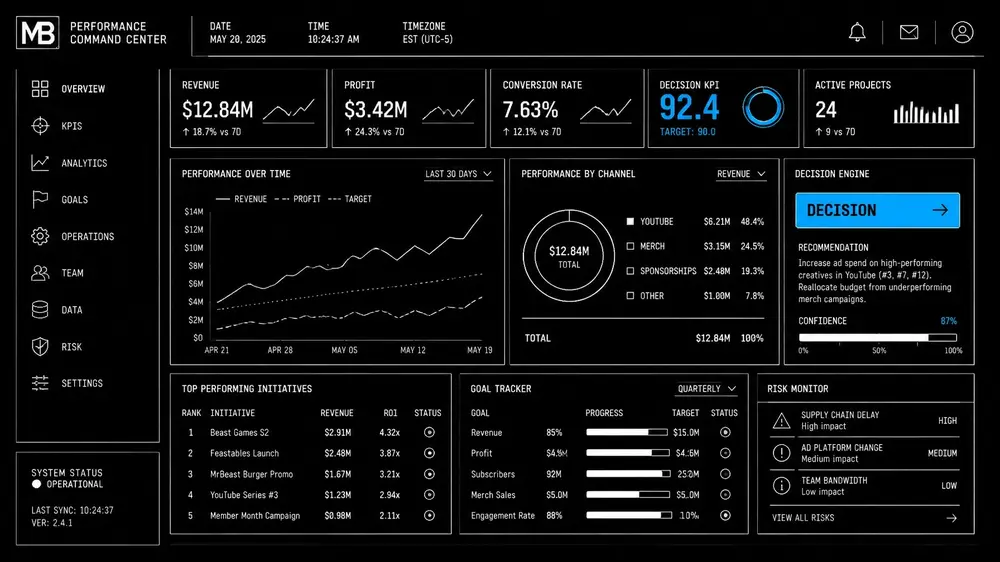
With a 90% rating in both ADA compliance and business acumen, He ensures that high-level data tools are both legally sound and strategically sharp. He understands that for a tool to be effective at a billion-dollar scale, it must be accessible to all decision-makers and resilient against technical or regulatory failure.
His visionary leadership is characterized by a "doer" mentality. He is as comfortable in the high-level strategy sessions of global corporations as He is in the technical weeds of data visualization architecture. This duality allows Him to oversee projects from the initial concept through to the generation of millions in revenue, maintaining a consistent standard of excellence throughout.
By the numbers: the impact of elite design
To understand the scope of His influence, one must look at the metrics that define His career. These are not just numbers; they are proof points of a philosophy that prioritizes results above all else.
- 25+ Years of professional experience in driving performance.
- 1.52 Million happy customers served through various projects.
- 172 Projects managed with precision and expertise.
- 1 US Utility Patent with a CIP held, demonstrating technical innovation.
- Top 100 Innovator recognition in US.
- 15+ Major Media features establishing global authority.
Expertise Ratings:
- UI/UX Design: 95%
- Product Management: 95%
- Business Acumen: 90%
- ADA Compliance: 90%
These figures represent a career dedicated to the pursuit of clarity in a world of noise. He has proven time and again that when data is visualized with precision, billion-dollar decisions become not just easier, but more successful.
Navigating the future of decision making
The future of business belongs to those who can see the path forward before the competition. As data grows in volume and complexity, the need for elite-level visualization only increases. He remains at the forefront of this evolution, combining design thinking with analytical insights to lead the way.
From prototyping and design to market research and process improvement, His comprehensive skill set provides a roadmap for growth. For those looking to scale their business, protect their IP, or simply make better decisions with the data they already have, the path is clear. High-stakes environments require high-stakes expertise.
When the numbers reach into the billions, the visual representation of that data is no longer a luxury: it is a necessity for survival and growth. If you are ready to transform your data into a strategic engine for revenue, we are here to help...